My interview with Jimmy Moore should be up on the day that this post becomes available. (I usually write my posts on weekends and schedule them for release at the beginning of the following weeks.) So the time is opportune for me to try to aswer this question: What is a good low carbohydrate diet?
For me, and many people I know, the answer is: a low calorie one. What this means, in simple terms, is that a good low carbohydrate diet is one with plenty of seafood and organ meats in it, and also plenty of veggies. These are low carbohydrate foods that are also naturally low in calories. Conversely, a low carbohydrate diet of mostly beef and eggs would be a high calorie one.
Seafood and organ meats provide essential fatty acids and are typically packed with nutrients. Because of that, they tend to be satiating. In fact, certain organ meats, such as beef liver, are so packed with nutrients that it is a good idea to limit their consumption. I suggest eating beef liver once or twice a week only. As for seafood, it seems like a good idea to me to get half of one’s protein from them.
Does this mean that the calories-in-calories-out idea is correct? No, and there is no need to resort to complicated and somewhat questionable feedback-loop arguments to prove that calories-in-calories-out is wrong. Just consider this hypothetical scenario; a thought experiment. Take two men, one 25 years of age and the other 65, both with the same weight. Put them on the same exact diet, on the same exact weight training regime, and keep everything else the same.
What will happen? Typically the 65-year-old will put on more body fat than the 25-year-old, and the latter will put on more lean body mass. This will happen in spite of the same exact calories-in-calories-out profile. Why? Because their hormonal mixes are different. The 65-year-old will typically have lower levels of circulating growth hormone and testosterone, both of which significantly affect body composition.
As you can see, it is not all about insulin, as has been argued many times before. In fact, average and/or fasting insulin may be the same for the 65- and 25-year-old men. And, still, the 65-year-old will have trouble keeping his body fat low and gaining muscle. There are other hormones involved, such as leptin and adiponectin, and probably several that we don’t know about yet.
A low carbohydrate diet appears to be ideal for many people, whether that is due to a particular health condition (e.g., diabetes) or simply due to a genetic makeup that favors this type of diet. By adopting a low carbohydrate diet with plenty of seafood, organ meats, and veggies, you will make it a low calorie diet. If that leads to a calorie deficit that is too large, you can always add a bit more of fat to it. For example, by cooking fish with butter and adding bacon to beef liver.
One scenario where I don’t see the above working well is if you are a competitive athlete who depletes a significant amount of muscle glycogen on a daily basis – e.g., 250 g or more. In this case, it will be very difficult to replenish glycogen only with protein, so the person will need more carbohydrates. He or she would need a protein intake in excess of 500 g per day for replenishing 250 g of glycogen only with protein.
Showing posts with label growth hormone. Show all posts
Showing posts with label growth hormone. Show all posts
Monday, June 6, 2011
Monday, May 2, 2011
Strength training plus fasting regularly, and becoming diabetic!? No, it is just compensatory adaptation at work
One common outcome of doing glycogen-depleting exercise (e.g., strength training, sprinting) in combination with intermittent fasting is an increase in growth hormone (GH) levels. See this post for a graph showing the acute effect on GH levels of glycogen-depleting exercise. This effect applies to both men and women, and is generally healthy, leading to improvements in mood and many health markers.
It is a bit like GH therapy, with GH being “administered” to you by your own body. Both glycogen-depleting exercise and intermittent fasting increase GH levels; apparently they have an additive effect when done together.
Still, a complaint that one sees a lot from people who have been doing glycogen-depleting exercise and intermittent fasting for a while is that their fasting blood glucose levels go up. This is particularly true for obese folks (after they lose body fat), as obesity tends to be associated with low GH levels, although it is not restricted to the obese. In fact, many people decide to stop what they were doing because they think that they are becoming insulin resistant and on their way to developing type 2 diabetes. And, surely enough, when they stop, their blood glucose levels go down.
Guess what? If your blood glucose levels are going up quite a bit in response to glycogen-depleting exercise and intermittent fasting, maybe you are one of the lucky folks who are very effective at increasing their GH levels. The blood glucose increase effect is temporary, although it can last months, and is indeed caused by insulin resistance. An HbA1c test should also show an increase in hemoglobin glycation.
Over time, however, you will very likely become more insulin sensitive. What is happening is compensatory adaptation, with different short-term and long-term responses. In the short term, your body is trying to become a more efficient fat-burning machine, and GH is involved in this adaptation. But in the short term, GH leads to insulin resistance, probably via actions on muscle and fat cells. This gradually improves in the long term, possibly through a concomitant increase in liver insulin sensitivity and glycogen storage capacity.
This is somewhat similar to the response to GH therapy.
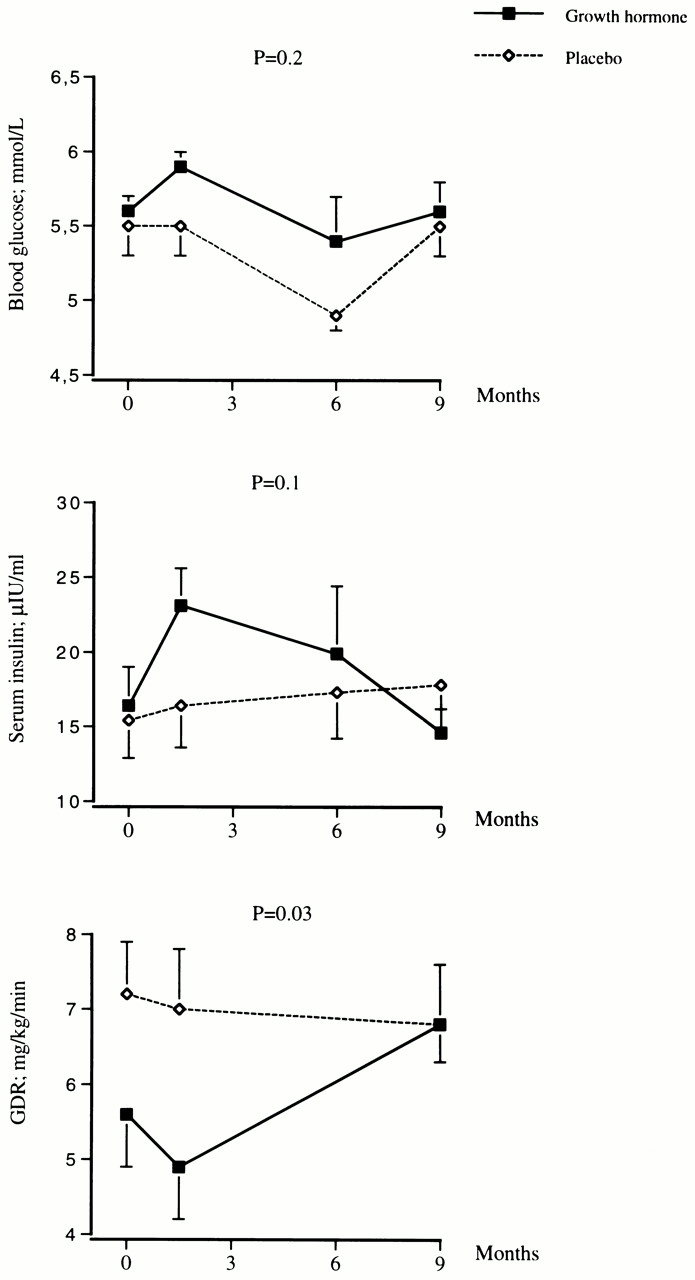
The figure below is from Johannsson et al. (1997). It shows what happened in terms of glucose metabolism when a group of obese men were administered recombinant GH for 9 months. The participants were aged 48–66, and were given in daily doses the equivalent to what would be needed to bring their GH levels to approximately what they were at age 20. For glucose, 5 mmol is about 90 mg, 5.5 is about 99, and 6 is about 108. GDR is glucose disposal rate; a measure of how quickly glucose is cleared from the blood.

As you can see, insulin sensitivity initially goes down for the GH group, and fasting blood glucose goes up quite a lot. But after 9 months the GH group has better insulin sensitivity. Their GDR is the same as in the placebo group, but with lower circulating insulin. The folks in the GH group also have significantly less body fat, and have better health markers, than those who took the placebo.
There is such a thing as sudden-onset type 2-like diabetes, but it is very rare (see Michael’s blog). Usually type 2 diabetes “telegraphs” its arrival through gradually increasing fasting blood glucose and HbA1c. However, those normally come together with other things, notably a decrease in HDL cholesterol and an increase in fasting triglycerides. Folks who do glycogen-depleting exercise and intermittent fasting tend to see the opposite – an increase in HDL cholesterol and a decrease in triglycerides.
So, if you are doing things that have the potential to increase your GH levels, a standard lipid panel can help you try to figure out whether insulin resistance is benign or not, if it happens.
By the way, GH and cortisol levels are correlated, which is often why some associate responses to glycogen-depleting exercise and intermittent fasting with esoteric nonsense that has no basis in scientific research like “adrenal fatigue”. Cortisol levels are meant to go up and down, but they should not go up and stay up while you are sitting down.
Avoid chronic stress, and keep on doing glycogen-depleting exercise and intermittent fasting; there is overwhelming scientific evidence that these things are good for you.
It is a bit like GH therapy, with GH being “administered” to you by your own body. Both glycogen-depleting exercise and intermittent fasting increase GH levels; apparently they have an additive effect when done together.
Still, a complaint that one sees a lot from people who have been doing glycogen-depleting exercise and intermittent fasting for a while is that their fasting blood glucose levels go up. This is particularly true for obese folks (after they lose body fat), as obesity tends to be associated with low GH levels, although it is not restricted to the obese. In fact, many people decide to stop what they were doing because they think that they are becoming insulin resistant and on their way to developing type 2 diabetes. And, surely enough, when they stop, their blood glucose levels go down.
Guess what? If your blood glucose levels are going up quite a bit in response to glycogen-depleting exercise and intermittent fasting, maybe you are one of the lucky folks who are very effective at increasing their GH levels. The blood glucose increase effect is temporary, although it can last months, and is indeed caused by insulin resistance. An HbA1c test should also show an increase in hemoglobin glycation.
Over time, however, you will very likely become more insulin sensitive. What is happening is compensatory adaptation, with different short-term and long-term responses. In the short term, your body is trying to become a more efficient fat-burning machine, and GH is involved in this adaptation. But in the short term, GH leads to insulin resistance, probably via actions on muscle and fat cells. This gradually improves in the long term, possibly through a concomitant increase in liver insulin sensitivity and glycogen storage capacity.
This is somewhat similar to the response to GH therapy.
The figure below is from Johannsson et al. (1997). It shows what happened in terms of glucose metabolism when a group of obese men were administered recombinant GH for 9 months. The participants were aged 48–66, and were given in daily doses the equivalent to what would be needed to bring their GH levels to approximately what they were at age 20. For glucose, 5 mmol is about 90 mg, 5.5 is about 99, and 6 is about 108. GDR is glucose disposal rate; a measure of how quickly glucose is cleared from the blood.
As you can see, insulin sensitivity initially goes down for the GH group, and fasting blood glucose goes up quite a lot. But after 9 months the GH group has better insulin sensitivity. Their GDR is the same as in the placebo group, but with lower circulating insulin. The folks in the GH group also have significantly less body fat, and have better health markers, than those who took the placebo.
There is such a thing as sudden-onset type 2-like diabetes, but it is very rare (see Michael’s blog). Usually type 2 diabetes “telegraphs” its arrival through gradually increasing fasting blood glucose and HbA1c. However, those normally come together with other things, notably a decrease in HDL cholesterol and an increase in fasting triglycerides. Folks who do glycogen-depleting exercise and intermittent fasting tend to see the opposite – an increase in HDL cholesterol and a decrease in triglycerides.
So, if you are doing things that have the potential to increase your GH levels, a standard lipid panel can help you try to figure out whether insulin resistance is benign or not, if it happens.
By the way, GH and cortisol levels are correlated, which is often why some associate responses to glycogen-depleting exercise and intermittent fasting with esoteric nonsense that has no basis in scientific research like “adrenal fatigue”. Cortisol levels are meant to go up and down, but they should not go up and stay up while you are sitting down.
Avoid chronic stress, and keep on doing glycogen-depleting exercise and intermittent fasting; there is overwhelming scientific evidence that these things are good for you.
Sunday, August 1, 2010
Growth hormone, insulin resistance, body fat accumulation, and glycogen depletion: Making sense of a mysterious hormone replacement therapy outcome
Hormone replacement therapies are prescribed in some cases, for medical reasons. They usually carry some risks. The risks come in part from the body down-regulating its own production of hormones when hormones are taken orally or injected. This could be seen as a form of compensatory adaptation, as the body tries to protect itself from abnormally high hormone levels.
More often than not the down-regulation can be reversed by interrupting the therapy. In some cases, the down-regulation becomes permanent, leading to significant health deterioration over the long run. One can seriously regret having started the hormone replacement therapy in the first place. The same is true (if not more) for hormone supplementation for performance enhancement, where normal hormone secretion levels are increased to enhance (mostly) athletic performance.
Rosenfalck and colleagues (1999) conducted an interesting study linking growth hormone (GH) replacement therapy with insulin resistance. Their conclusions are not very controversial. What I find interesting is what their data analysis unveiled and was not included in their conclusions. Also, they explain their main findings by claiming that there was a deterioration of beta cell function. (Beta cells are located in the pancreas, and secrete insulin.) While they may be correct, their explanation is not very plausible, as you will see below.
Let us take a quick look at what past research says about GH therapy and insulin resistance. One frequent finding is a significant but temporary impairment of insulin sensitivity, which usually normalizes after a period of a few months (e.g., 6 months). Another not so frequent finding is a significant and permanent impairment of insulin sensitivity; this is not as frequent in healthy individuals.
The researchers did a good job at reviewing this literature, and concluded that in many cases GH therapy is not worth the risk. They also studied 24 GH-deficient adults (18 males and 6 females). All of them had known pituitary pathology, which caused the low GH levels. The participants were randomly assigned to two groups. One received 4 months treatment with biosynthetic GH daily (n=13); the other received a placebo (n=11).
The table below (click on it to enlarge) shows various measures before and after treatment. Note the significant reduction in abdominal fat mass in the GH group. Also note that, prior to the treatment, the GH group folks (who were GH-deficient) were overall much heavier and much fatter, particular at the abdominal area, than the folks in the placebo (or control) group.

From the measures above one could say that the treatment was a success. But the researchers point out that it was not, because insulin sensitivity was significantly impaired. They show some graphs (below), and that is where things get really interesting, but not in the way intended by the researchers.

On the figure above, the graphs on the left refer to the placebo group, and on the right to the GH group. The solid lines reflect pre-treatment numbers and dotted lines post-treatment numbers. Indeed, GH therapy is making the GH-deficient folks significantly more insulin resistant.
But look carefully. The GH folks are more insulin sensitive than the controls prior to the treatment, even though they are much fatter, particularly in terms of abdominal fat. The glucose response is significantly lower for the GH-deficient folks, and that is not due to them secreting more insulin. The insulin response is also significantly lower. This is confirmed by glucose and insulin “area under the curve” measures provided by the researchers.
In fact, after treatment both groups seem to have generally the same insulin and glucose responses. This means that the GH treatment made insulin-sensitive folks a bit more like their normal counterparts in the placebo group. But obviously the change for the worse occurred only in the GH group, which is what the researchers concluded.
Now to the really interesting question, at least in my mind: What could have improved insulin sensitivity in the GH-deficient group prior to the treatment?
The GH-deficient folks had more body fat, particularly around the abdominal area. High serum GH is usually associated with low body fat, particularly around the abdominal area, because high GH folks burn it easily. So, looking at it from a different perspective, the GH-deficient folks seem to have been more effective at making body fat, and less effective at burning it.
Often we talk about insulin sensitivity as though there was only one type. But there is more than one type of insulin sensitivity. Insulin signals to the liver to take up glucose from the blood and turn it into glycogen or fat. Insulin also signals to body fat tissue to take up glucose from the blood and make fat with it. (GLUT 4 is an insulin-sensitive glucose transporter present in both fat and muscle cells.)
Therefore, it is reasonable to assume that folks with fat cells that are particularly insulin-sensitive would tend to make body fat quite easily based on glucose. While this is a type of insulin sensitivity that most people probably do not like to have, it may play an important role in reducing blood glucose levels under certain conditions. This appears to be true in the short term. Down the road, having very insulin-sensitive fat cells seems to lead to obesity, the metabolic syndrome, and diabetes.
In fact, in individuals without pituitary pathology, increased insulin sensitivity in fat cells could be a compensatory adaptation in response to a possible decrease in liver and muscle glucose uptake. Lack of exercise will shift the burden of glucose clearance to tissues other than liver and muscle, because with glycogen stores full both liver and muscle will usually take up much less blood glucose than they would otherwise.
I am speculating here, but I think that in individuals without pituitary pathology, an involuntary decrease in endogenous GH secretion may actually be at the core of this compensatory adaptation mechanism. In these individuals, low GH levels may be an outcome, not a cause of problems. This would explain two apparently contradictory findings: (a) GH levels drop dramatically in the 40s, particularly for men; and (b) several people in their 50s and 60s, including men, have much higher levels of circulating GH than people in their 40s, and even than much younger folks.
Vigorous exercise increases blood glucose uptake, inside and outside the exercise window; this is an almost universal effect among humans. Exercise depletes muscle and liver glycogen. (Fasting and low-carbohydrate dieting alone deplete liver, but not muscle, glycogen.) As glycogen stores become depleted, the activity of glycogen synthase (an enzyme involved in the conversion of glucose to glycogen) increases acutely. This activity remains elevated for several days in muscle tissue; the liver replenishes its glycogen in a matter of hours. With glycogen synthase activity elevated, glucose is quickly used to replenish glycogen stores, and not to make fat.
Depleting glycogen stores on a regular basis (e.g., once every few days) may over time reverse the adaptations that made fat cells particularly insulin-sensitive in the first place. Those adaptations become a protection that is not only no longer needed but also detrimental to health, since they lead to obesity. This could be the reason why many people initially find it difficult to lower their body fat set point, but once they lose body fat and stay lean for a while, they seem to become able to maintain their leanness without much effort.
Well, perhaps glycogen-depleting exercise is more important than many people think. It can help make you thin, but through a circuitous path.
And, incidentally, glycogen-depleting exercise causes a temporary but dramatic spike in GH secretion. This natural increase in GH secretion does not seem to be associated with any significant impairment in overall insulin sensitivity, even though glycogen-depleting exercise increases blood glucose levels a lot during the exercise window. This is a temporary and physiological, not pathological, phenomenon.
Reference:
Rosenfalck A.M., Fisker, S., Hilsted, J., Dinesen, B., Vølund, A., Jørgensen, J.O., Christiansen, J.S., & Madsbad, S. (1999). The effect of the deterioration of insulin sensitivity on beta-cell function in growth-hormone-deficient adults following 4-month growth hormone replacement therapy. Growth Hormone & IGF Research, 9(2), 96–105.
Monday, June 7, 2010
Niacin turbocharges the growth hormone response to anaerobic exercise: A delayed effect
Niacin is also known as vitamin B3, or nicotinic acid. It is an essential vitamin whose deficiency leads to pellagra. In large doses of 1 to 3 g per day it has several effects on blood lipids, including an increase in HDL cholesterol and a marked decreased in fasting triglycerides. Niacin is also a powerful antioxidant.
Among niacin’s other effects, when taken in large doses of 1 to 3 g per day, is an acute elevation in growth hormone secretion. This is a delayed effect, frequently occurring 3 to 5 hours after taking niacin. This effect is independent of exercise.
It is important to note that large doses of 1 to 3 g of niacin are completely unnatural, and cannot be achieved by eating foods rich in niacin. For example, one would have to eat a toxic amount of beef liver (e.g., 15 lbs) to get even close to 1 g of niacin. Beef liver is one of the richest natural sources of niacin.
Unless we find out something completely unexpected about the diet of our Paleolithic ancestors in the future, we can safely assume that they never benefited from the niacin effects discussed in this post.
With that caveat, let us look at yet another study on niacin and its effect on growth hormone. Stokes and colleagues (2008) conducted a study suggesting that, in addition to the above mentioned beneficial effects of niacin, there is another exercise-induced effect: niacin “turbocharges” the growth hormone response to anaerobic exercise. The full reference to the study is at the end of this post. Figure 3, shown below, illustrates the effect and its magnitude. Click on it to enlarge.

The closed diamond symbols represent the treatment group. In it, participants ingested a total of 2 g of niacin in three doses: 1 g ingested at 0 min, 0.5 g at 120 min, and 0.5 g at 240 min. The control group ingested no niacin, and is represented by the open square symbols. (The researchers did not use a placebo in the control group; they justified this decision by noting that the niacin flush nullified the benefits of using a placebo.) The arrows indicate points at which all-out 30-second cycle ergometer sprints occurred.
Ignore the lines showing the serum growth hormone levels in between 120 and 300 min; they were not measured within that period.
As you can see, the peak growth hormone response to the first sprint was almost two times higher in the niacin group. In the second sprint, at 300 min, the rise in growth hormone is about 5 times higher in the niacin group.
We know that growth hormone secretion may rise 300 percent with exercise, without niacin. According to this study, this effect may be “turbocharged” up to a 600 percent rise with niacin within 300 min (5 h) of taking it, and possibly 1,500 percent soon after 300 min passed since taking niacin.
That is, not only does niacin boost growth hormone secretion anytime after it is taken, but one still gets the major niacin increase in growth hormone at around 300 min of taking it (which is about the same, whether you exercise or not). Its secretion level at this point is, by the way, higher than its highest level typically reached during deep sleep.
Let me emphasize that the peak growth hormone level achieved in the second sprint is about the same you would get without exercise, namely a bit more than 20 micrograms per liter, as long as you took niacin (see Quabbe's articles at the end of this post).
Still, if you time your exercise session to about 300 min after taking niacin you may have some extra benefits, because getting that peak growth hormone secretion at the time you are exercising may help boost some of the benefits of exercise.
For example, the excess growth hormone secretion may reduce muscle catabolism and increase muscle anabolism, at the same time, leading to an increase in muscle gain. However, there is evidence that growth hormone-induced muscle gain occurs only when testosterone levels are elevated. This explains why growth hormone levels are usually higher in young women than young men, and yet young women do not put on much muscle in response to exercise.
Reference:
Stokes, K.A., Tyler, C., & Gilbert, K.L. (2008). The growth hormone response to repeated bouts of sprint exercise with and without suppression of lipolysis in men. Journal of Applied Physiology, 104(3), 724-728.
Friday, June 4, 2010
Growth hormone secretion drops with age, but not exactly in the way you would expect
Many people assume that growth hormone secretion drops with age in a somewhat linear fashion, as implied by this diagram. This assumption probably stems from attempts to model growth hormone variations with linear regression algorithms. This assumption is wrong.
Actual plots of growth hormone secretion patterns, with age on the horizontal axes, tell a different story. See, for example, the graphs below, from professionalmuscle.com. They match the graphs one sees in empirical academic papers. The graphs below (click to enlarge) are particularly good at highlighting some interesting patterns of variation.

On the left side, bar charts show secretion patterns grouped by age ranges during a 24 h period (at the top), during wake time (at the middle), and during sleep (at the bottom). On the right side is the actual data used to build the bar charts. As you can see from the graphs on the right side, the drop in growth hormone secretion follows a pattern that looks a lot more like an exponential decay than a linear pattern.
The drop is very steep from 15 to 40 years of age, after which it shows some fluctuations, going up and down. Interestingly, people in their 50s and 60s, at least in this dataset, have on average higher growth hormone levels than people in their 40s. Of course this may be due to sample bias, but the graphs suggest that there is a major drop in growth hormone secretion, on average, around age 45.
As you can see, there is a lot of individual variation in growth hormone levels. If you look carefully at the graph on the top-right corner, you will see a 50 year old who has a higher 24 h growth hormone secretion than many folks in 15-30 age range. This pattern of individual variation is common for the vast majority of traits anyway, and often the distribution of traits follows a normal, or bell-shaped, distribution. The bell-shaped distribution becomes clear when the traits are plotted based on frequency.
Growth hormone is secreted in pulses. In case you are wondering, growth hormone secretion in young women is higher than in young men. See the graphs below (click to enlarge), from this excellent article on growth hormone by Cummings and Merrian.

Yet, women do not put on a lot of muscle mass in response to weight training, regardless of the age at which they do weight training. This means that growth hormone, by itself, does not lead to significant gains in muscle mass. Androgenic hormones, like testosterone, play a key moderator role here. Muscle mass gain is the result of a number of things, including the combined action of various hormones. To complicate things further, not only do these hormones act together in an additive fashion, but they also influence each other.
Another reasonable conclusion from the data above on growth hormone secretion in young women and men is that growth hormone must indeed have major health-promoting effects, as most of the empirical data suggests. The reason is that, from an evolutionary standpoint, young (or pre-menopausal) women have always been the evolutionary bottleneck of any population of ancestral hominids. High survival rates among young women were a lot more important than high survival rates among men in general, in terms of the chances of survival of any population of ancestral hominids.
Higher survival rates among young ancestral women may have been enabled by higher levels of growth hormone, among other things. The onset of the metabolic syndrome, which is frequently in modern humans around age 45, may also be strongly influenced by falling growth hormone levels.
How can growth hormone secretion be increased after age 45? One obvious option is vigorous exercise, particularly resistance exercise.
Sunday, May 30, 2010
Growth hormone may rise 300 percent with exercise: Acute increases also occur in cortisol, adrenaline, and noradrenaline
The figure below (click to enlarge) is from the outstanding book Physiology of sport and exercise, by Jack H. Wilmore, David L. Costill, and W. Larry Kenney. If you are serious about endurance or resistance exercise, or want to have a deeper understanding of exercise physiology beyond what one can get in popular exercise books, this book should be in your personal and/or institutional library. It is one of the most comprehensive textbooks on exercise physiology around. The full reference to the book is at the end of this post.

The hormonal and free fatty acid responses shown on the two graphs are to relatively intense exercise combining aerobic and anaerobic components. Something like competitive cross-country running in an area with hills would lead to that type of response. As you can see, cortisol spikes at the beginning, combining forces with adrenaline and noradrenaline (a.k.a. epinephrine and norepinephrine) to quickly increase circulating free fatty acid levels. Then free fatty acid levels are maintained elevated by adrenaline, noradrenaline, and growth hormone. As you can see from the graphs, free fatty acid levels are initially pulled up by cortisol, and then are very strongly correlated with adrenaline and noradrenaline. Those free fatty acids feed muscle, and also lead to the production of ketones, which provide extra fuel for muscle tissue.
Growth hormone stays flat for about 40 minutes, after which it goes up steeply. At around the 90-minute mark, it reaches a level that is quite high; 300 percent higher than it was prior to the exercise session. Natural elevation of circulating growth hormone through intense exercise, intermittent fasting, and restful sleep, leads to a number of health benefits. It helps burn abdominal fat, often hours after the exercise session, and helps builds muscle (in conjunction with other hormones, such as testosterone). It appears to increase insulin sensitivity in the long run. Maybe natural elevation of circulating growth hormone is one of the “secrets” of people like Bob Delmonteque, who is probably the fittest octogenarian in the world today.
Aerobic activities normally do not elevate growth hormone levels, even though they are healthy, unless they lead to a significant degree of glycogen depletion. Glycogen is stored in the liver and muscle, with muscle storing about 5 times more than the liver (about 500 g in adults). Once those reserves go down significantly during exercise, it seems that growth hormone is recruited to ramp up fat catabolism and facilitate other metabolic processes. Walking for an hour, even if briskly, is good for fat burning, but generates only a small growth hormone elevation. Including a few all-out sprints into that walk can help significantly increase growth hormone secretion.
Having said that, it is not really clear whether growth hormone elevation is a response to glycogen depletion, or whether both happen together in response to another stimulus or related metabolic process. There are other factors that come into play as well. For example, circulating growth hormone increase is moderated by sex hormone (e.g., testosterone, estrogen) secretion, thus larger growth hormone increases in response to exercise are observed in older men than in older women. (Testosterone declines more slowly with age in men than estrogen does in women.) Also, growth hormone increase seems to be correlated with an increase in circulating ketones.
Heavy resistance exercise seems to lead to a higher growth hormone elevation per unit of time than endurance exercise. That is, an intense resistance training session lasting only 30 minutes can lead to an acute circulating growth hormone response, similar to that shown on the figure. The key seems to be reaching the point during the exercise where muscle glycogen stores are significantly depleted. Many people who weight-train achieve this regularly by combining a reasonable number of sets (e.g., 6-12), with repetitions in the muscle hypertrophy range (again, 6-12); and progressive overload, whereby resistance is increased incrementally every session.
Progressive overload is needed because glycogen reserves are themselves increased in response to training, so one has to increase resistance every session to keep up with those increases. This goes on only up to a point, a point of saturation, usually reached by elite athletes. Glycogen is the primary fuel for anaerobic exercise; fat is used as fuel in the recovery period between sets, and after the exercise is over. Glycogen is expended proportionally to the number of calories used in the anaerobic effort. Calories are expended proportionally to the total amount of weight moved around, and are also a function of the movements performed (moving a certain weight 1 feet spends less energy than moving it 3 feet). By the way, not much glycogen is depleted in a 30-minute session. The total caloric expenditure will probably be around 250 calories above the basal metabolic rate, which will require about 63 g of glycogen.
Many sensations are associated with reaching the glycogen depletion level required for an acute growth hormone response during heavy anaerobic exercise. Often light to severe nausea is experienced. Many people report a “funny” feeling, which is unmistakable to them, but very difficult to describe. In some people the “funny” feeling is followed, after even more exertion, by a progressively strong sensation of “pins and needles”, which, unlike that associated with a heart attack, comes slowly and also goes away slowly with rest. Some people feel lightheaded as well.
It seems that the optimal point is reached immediately before the above sensations become bothersome; perhaps at the onset of the “funny” feeling. My personal impression is that the level at which one experiences the “pins and needles” sensation should be avoided, because that is a point where your body is about to “force” you to stop exercising. (Note: I am not a bodybuilder; see “Interesting links” for more extensive resources on the subject.) Besides, go to that point or beyond and significant muscle catabolism may occur, because the body prioritizes glycogen reserves over muscle protein. It will break that protein down to produce glucose via gluconeogenesis to feed muscle glycogenesis.
That the body prioritizes muscle glycogen reserves over muscle protein is surprising to many, but makes evolutionary sense. In our evolutionary past, there were no selection pressures on humans to win bodybuilding tournaments. For our hominid ancestors, it was more important to have the glycogen tank at least half-full than to have some extra muscle protein. Without glycogen, the violent muscle contractions needed for a “fight or flight” response to an animal attack simply cannot happen. And large predators (e.g., a bear) would not feel intimated by big human muscles alone; it would be the human’s response using those muscles that would result in survival or death.
Overall, selection pressures probably favored functional strength combined with endurance, leading to body types similar to those of the hunter-gatherers shown on this post.
Even though the growth hormone response to exercise can be steep, the highest natural growth hormone spike seems to be the one that occurs at night, during deep sleep.
Exercising hard pays off, but only if one sleeps well.
Reference:
Wilmore, J.H., Costill, D.L., & Kenney, W.L. (2007). Physiology of sport and exercise. Champaign, IL: Human Kinetics.
Friday, May 7, 2010
Niacin and its effects on growth hormone, glucagon, cortisol, blood lipids, mental disorders, and fasting glucose levels
Niacin is a very interesting vitamin. It is also known as vitamin B3, or nicotinic acid. It is an essential vitamin whose deficiency leads to a dreadful disease known as pellagra. In large doses of 1 to 3 g per day it has several effects on blood lipids, including these: it increases HDL cholesterol, decreases triglycerides, and decreases Lp(a). Given that this is essentially a reversal of the metabolic syndrome, for those who are on their way to developing it, niacin must really do something good for our body. Niacin is also a powerful antioxidant.
The lipid modification effects of niacin are so consistent across a broad spectrum of the population that some companies that commercialize niacin-based products guarantee some measure of those effects. The graphs below (click to enlarge) are from Arizona Pharmaceuticals, a company that commercializes an instant-release niacin formulation called Nialor (see: arizonapharmaceuticals.com). The graphs show the peak effects on HDL cholesterol and triglycerides at the recommended dose, which is 1.5 g per day. The company guarantees effects; not the peak effects shown, but effects that are large enough to have clinical significance.

Niacin also has been used in the treatment of various mental disorders, including schizophrenia. Its effectiveness in this domain (mental disease) is still under debate. Yet many people, including reputable mental health researchers, swear by it. Empirical research suggests beyond much doubt that niacin helps in the treatment of depression and bipolar disorder.
Abram Hoffer, a Canadian psychiatrist who died in 2009, at the age of 91, has discussed at length the many beneficial health effects of niacin. He was also a niacin user. He argued that it can even make people live longer, and be generally healthier and more active. The effect on longevity may sound far-fetched, but there is empirical data supporting this hypothesis as well. (For more, see this book.)
By the way, moderate niacin supplementation seems to increase the milk output of cows, without any effect on milk composition.
Most people dislike the sensation that is caused by niacin, the “niacin flush”. This is a temporary sensation similar to that of sunburn covering one’s full torso and face. It goes away after a few minutes. This is niacin’s main undesirable side effect at doses up to 3 g per day. Higher doses are not recommended, and can be toxic to the liver.
Nobody seems to understand very well how niacin works. This leads to some confusion. Many people think that niacin inhibits the production of VLDL, free fatty acids, and ketones; preventing the use of fat as an energy source. And it does!
So it makes you fat, right?
No, because these effects are temporary, and are followed, often after 3 to 5 hours, by a large increase in circulating growth hormone, cortisol and glucagon. These hormones are associated with (maybe they cause, maybe are caused by) a large increase in free fatty acids and ketones in circulation, but not with an increase in VLDL secretion by the liver. So ketosis is at first inhibited by niacin, and then comes in full force after a few hours.
The decreased VLDL secretion is no surprise, because VLDL is not really needed in large quantities if muscle tissues (including the heart) are being fed what they really like: free fatty acids and ketones. When VLDL particles are secreted by the liver in small numbers, they tend to be large. As they shrink in size after delivering their lipid content to muscle tissues, they become large LDL particles; too large to cross the endothelial gaps and cause plaque formation.
It is as if niacin held you back for a few hours, in terms of fat burning, and then released you with a strong push.
Since niacin does not seem to suppress the secretion of chylomicrons by the intestines, it should be taken with meals. The meals do not necessarily have to have any carbohydrates in them. If you take niacin while fasting, you may feel “funny” and somewhat weak, because of the decrease in VLDL, free fatty acids, and ketones in circulation. These, particularly the free fatty acids and ketones, are important sources of energy in the fasted state.
Given niacin’s delayed effects, it does not seem to make much sense to take slow release niacin of any kind. In fact, the form of niacin that seems to work best is the instant-release one, the one that gives you the flush. It may be a good idea to wait until 3 to 5 hours after you take it to do heavy exercise. You may feel a surge of energy 3 to 5 hours after taking it, when the delayed effects kick in.
The delayed effects of niacin on growth hormone, cortisol and glucagon are probably the reasons why people taking niacin frequently see a small increase in fasting glucose levels. This increase is usually of a few percentage points, but can be a bit higher in some people. Growth hormone, cortisol and particularly glucagon increase blood glucose levels; and the blood levels of these hormones naturally rise in the morning to get you ready for the day ahead. Niacin seems to boost that. Hence the increase in fasting blood glucose levels. This appears to be a benign effect, easily counterbalanced by niacin’s many benefits.
In spite of a possible increase in fasting glucose levels, there is no evidence that niacin increases average blood glucose levels. If it did, that would not be a good thing. In fact, it has been argued that niacin intake can be part of an effective approach to treating diabetes; Robert C. Atkins discussed this in his Vita-Nutrient Solution book.
Niacin’s effects on lipids are somewhat similar to those of low carbohydrate dieting. For example, both lead to a decrease in fasting triglycerides and an increase in HDL cholesterol. But the mechanisms by which those effects are achieved appear to be rather different.
References:
Quabbe, H.J., Trompke, M., & Luyckx, A.S. (1983). Influence of ketone body infusion on plasma growth hormone and glucagon in man. J. Clin Endocrinol Metab., 57(3):613-8.
Quabbe, H.J., Luyckx, A.S., L'age M., & Schwarz, C. (1983). Growth hormone, cortisol, and glucagon concentrations during plasma free fatty acid depression: different effects of nicotinic acid and an adenosine derivative (BM 11.189). J. Clin Endocrinol Metab., 57(2):410-4.
Schade, D.S., Woodside, W., & Eaton, R.P. (1979). The role of glucagon in the regulation of plasma lipids. Metabolism, 28(8):874-86.
Thursday, December 24, 2009
Growth hormone: The fountain of youth
Growth hormone, also known as human growth hormone, seems to be implicated in a number of metabolic conditions associated with aging, and, more generally, poor health.
In adults, growth hormone deficiency is associated with: decreased calcium retention and osteoporosis, loss of muscle mass, increased fat deposition, decreased protein synthesis, and immunodeficiency. In children, growth hormone deficiency is associated with stunted growth.
Levels of growth hormones decline with age, and their decrease is believed to contribute to the aging process. Abdominal obesity is associated with low levels of growth hormone, and is also associated with the onset of the metabolic syndrome, a precursor of diabetes and cardiovascular disease.
While there are many treatments in the market that include exogenous administration of growth hormones (e.g., through injection), there are several natural ways in which growth hormone levels can be increased. These natural ways can often lead to more effective and sustainable results than prescription drugs.
For example, fasting stimulates the natural production of growth hormone. So does vigorous exercise, particularly resistance exercise with a strong anaerobic component (not cardio though). And, to the surprise of many people, deep sleep stimulates the natural production of growth hormone, perhaps more than anything else. (Although only once every 24 hours; sleeping all day does not seem to work.)
In fact, during a 24-hour period, growth hormone typically varies in pulses, or cycles. The pulses are somewhat uniformly distributed during the day, with a peak occurring at night. The graph below (source: Fleck & Kraemer, 2004) plots the typical variation of growth hormone during a 12-hour period, including the deep sleep period.

As you can see, growth hormone peaks during deep sleep; which is achieved a few hours after one goes to bed, and not too long before one wakes up.
By the way, if you want to know more about human physiology and metabolism, forget about popular diet and exercise books. Next to peer-reviewed academic articles (which are often hard to read), the best sources are college textbooks used in courses on physical education, nutrition, endocrinology, and related topics. The book from which the graph above was taken (Fleck & Kraemer, 2004), is a superb example of that.
Reference:
Fleck, S.J., & Kraemer, W.J. (2004). Designing resistance training programs. Champaign, IL: Human Kinetics.
Subscribe to:
Posts (Atom)